Pressure Statistics
15/12/25 04:45:00 GMT
Pressure plots
24 hours pressure plot
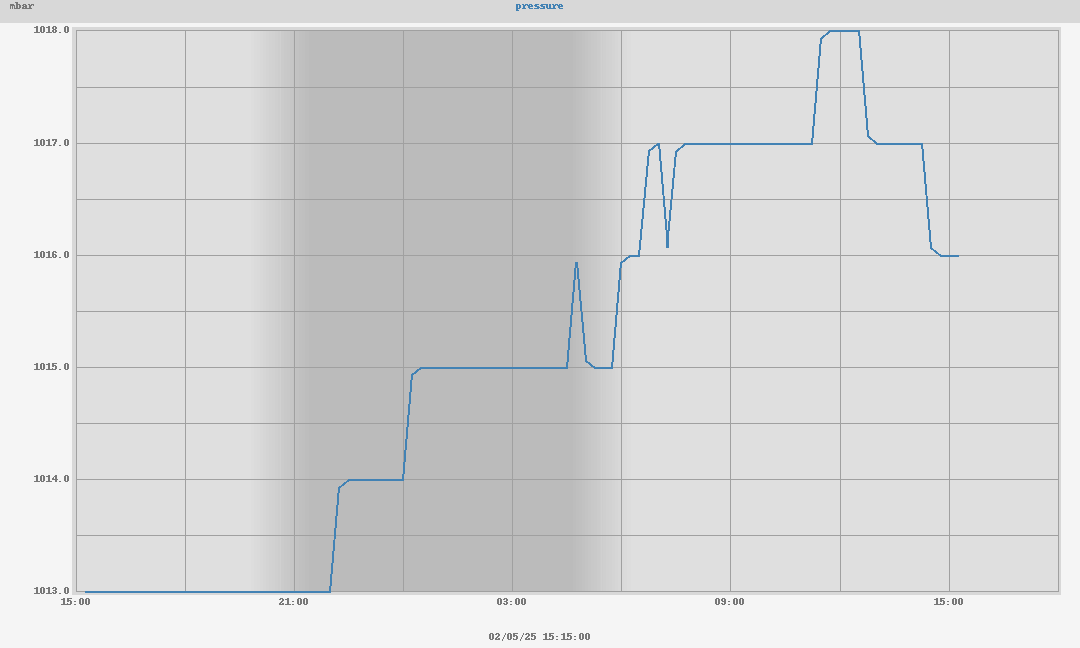
Pressure Details
| Current Pressure | 1000.0 mbar |
| Barometer Trend (3 hours) | -1.0 mbar |
Weekly pressure plots
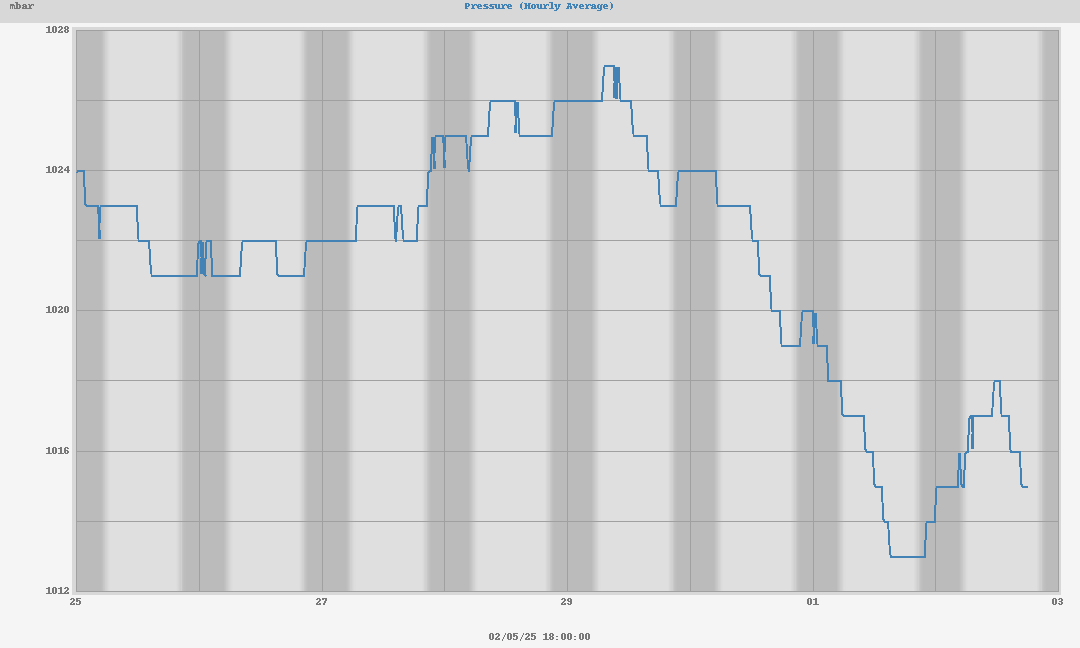
Weekly Stats
| Weekly High | 1002.0 mbar at 00:15:00 (Monday) |
| Weekly Low | 1000.0 mbar at 03:37:26 (Monday) |
Monthly pressure plots
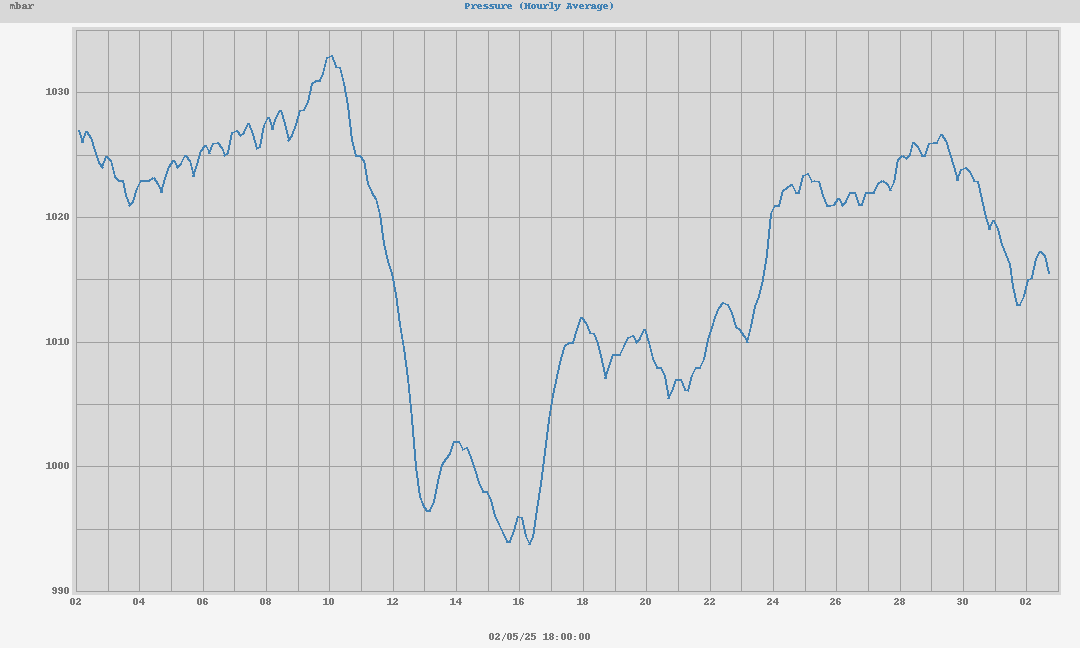
Monthly Stats
| Monthly High | 1023.0 mbar at 13/12/25 07:07:25 |
| Monthly Low | 983.0 mbar at 06/12/25 01:00:00 |
Yearly pressure plots
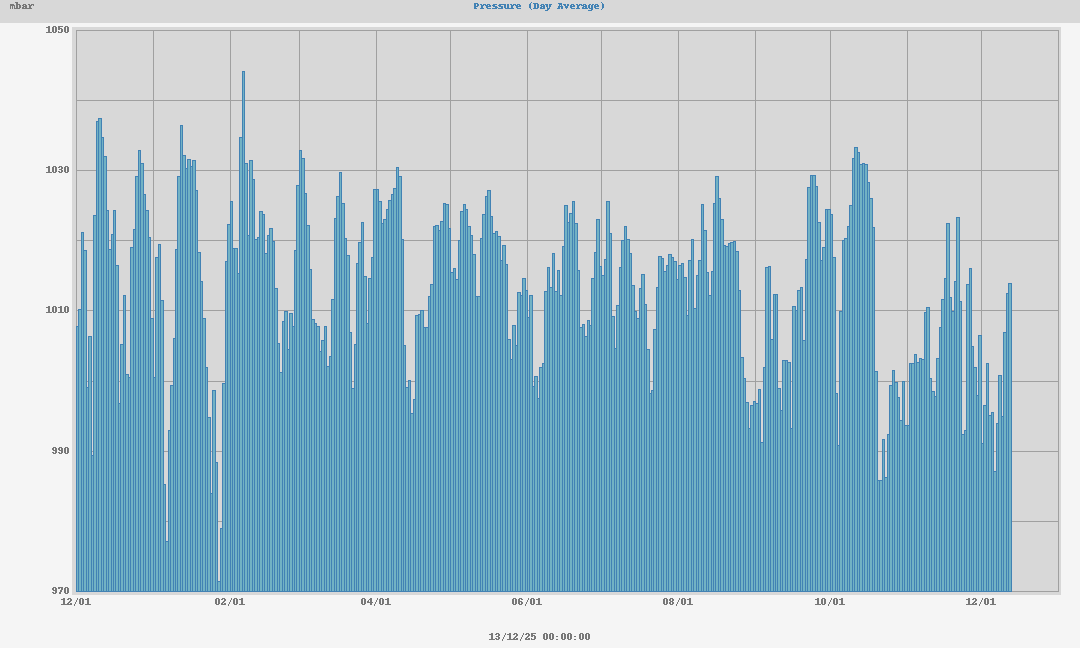
Yearly Stats
| Yearly High | 1045.0 mbar at 06/02/25 05:44:47 |
| Yearly Low | 969.0 mbar at 27/01/25 04:15:00 |